Tracks Analyzer
Overview
Tracks Analyzer is a web tool that helps analyze repeating track segments between selected points on the map. To use this feature with your own data, you need an OsmAnd Pro account with tracks synced to OsmAnd Cloud — otherwise, your tracks won’t be available on the Web Planner. It scans your tracks and finds all segments that pass through the chosen location(s), allowing you to compare speed, elevation, distance, and time across multiple activities.
How to Use
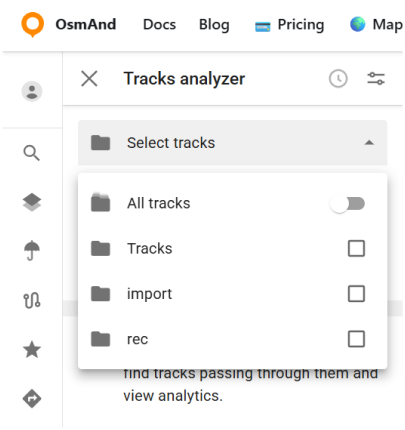
After opening the Tracks Analyzer (shown as a wrench), the tool opens with a map view and an empty state. From here, you can choose which tracks will be included in the analysis using the Select tracks panel. The analyzer allows working with all available tracks or limiting the analysis to specific folders.
To start the analysis, set one or two points directly on the map. Right-click on the desired location and select Point A / Point B from the context menu. The analyzer then searches for track segments that pass through the selected point or between the two points.

Sorting and Visible Parameters
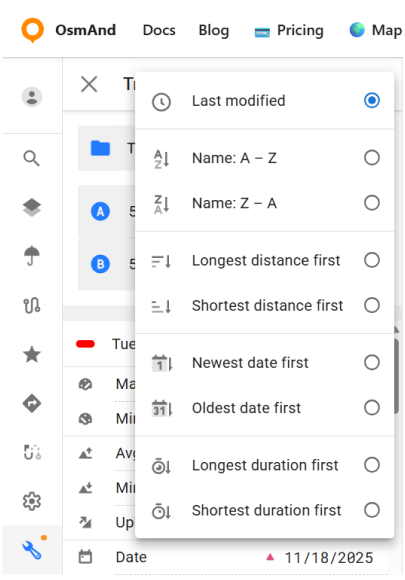
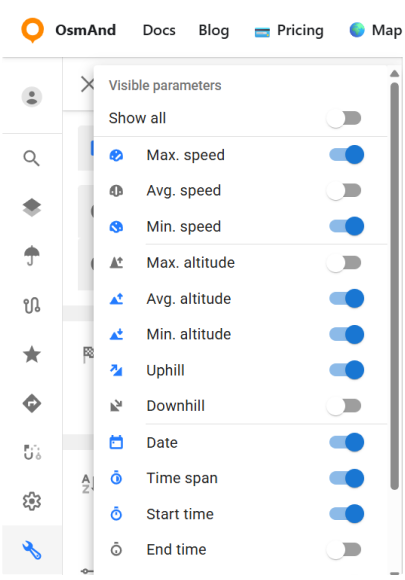
After the analyzer finds matching segments, the results are shown as a list. The list can be reordered using the Sort option, which changes how segments are listed. In addition, the Fields button opens the Visible parameters panel, where you can control which analysis parameters are shown for each segment. You can display all available parameters or select only those relevant to your analysis.
The available parameters are grouped by type:
Speed
- Max. speed
- Avg. speed
- Min. speed
Altitude
- Max. altitude
- Avg. altitude
- Min. altitude
Uphill / Downhill
Date and time
- Date
- Start time
- End time
- Time span
- Duration
- Time in motion
Length
Data Analysis
Each matching segment is shown in the results list on the left. For every segment, a set of calculated parameters is displayed, depending on which Visible parameters are enabled.
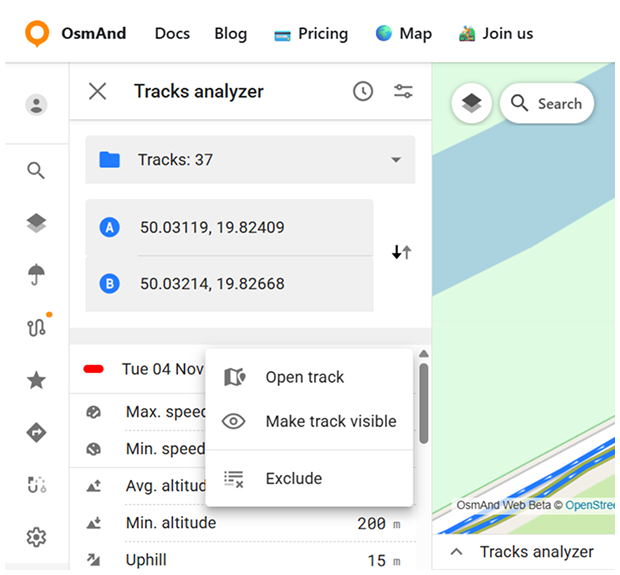
Each segment also has a three-dot menu (⋮) with the following actions:
- Open track — opens the full track related to the selected segment.
- Hide track / Make track visible — controls whether the track is shown on the map.
- Exclude — removes the segment from the current analysis results.
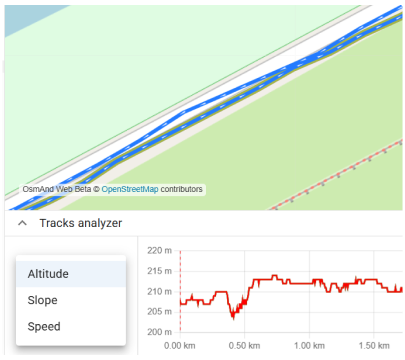
Graphs
Below the map, the analyzer displays a graph that visualizes the selected segments. The graph represents data only for the segments found between the selected points, not the entire tracks.
The graph supports switching between different data types:
- Altitude.
- Slope.
- Speed. Only one data type is displayed at a time, and changing it updates the graph immediately.
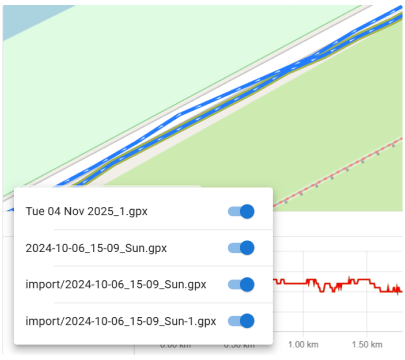
When multiple segments are present, the graph shows data for several segments simultaneously. A selector above the graph allows you to choose how many segment graphs are displayed at once and to switch between them.